Pro vs Partner: Choosing and Using the Right ChromeOS Readiness Tool Dashboard
Migrating to ChromeOS is a strategic decision and success depends on a deep understanding of your current IT environment. The ChromeOS Readiness Tool simplifies this process through powerful assessments and a web-based dashboard that visualizes your organization's readiness.
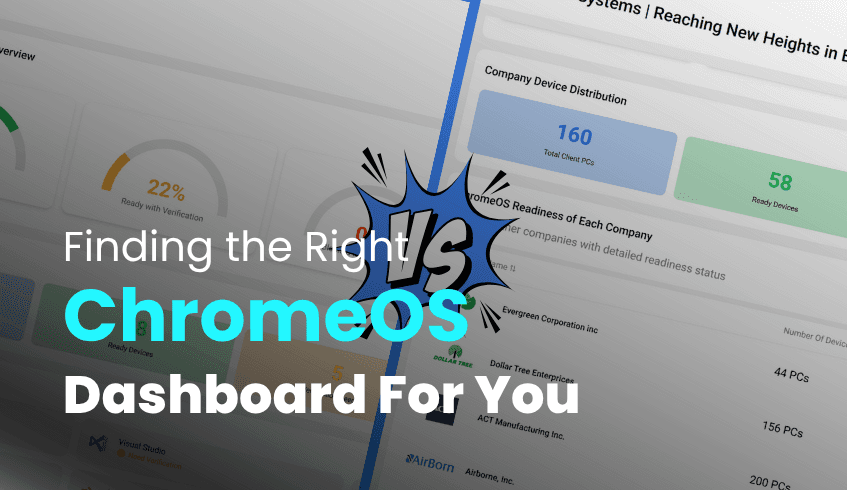
But not all users interact with the tool the same way. Depending on your role, you’ll use either the Pro Dashboard or the Partner Dashboard. Here's what sets them apart and how to use them effectively.
The Pro Dashboard: For Enterprise Teams Managing Their Own Migrations
The Pro Dashboard is designed for organizations conducting their own ChromeOS readiness assessments. It provides a comprehensive view of your internal environment:
Company wide readiness metrics by application, device, and peripheral
Application usage analysis, including foreground and background categorization
Filtering tools for device readiness status and application tags
Drill downs to domain or application level insights
Accessing the Pro Dashboard
Visit the web dashboard login page
Sign in using your Google account
Enter the private key generated during tool deployment
This key is required to unlock detailed readiness data and ensures access is restricted to authorized users.
Availability Based on Installation Flow
Enterprise Flow (with Active Directory/GPO): The Pro Dashboard is available only if GCP Cloud Storage is enabled for assessment results
PowerShell Flow (cloud-based, UEM-friendly): The Pro Dashboard is available by default
The Partner Dashboard: For Service Providers Managing Multiple Clients
The Partner Dashboard is built for Cloud Solution Providers (CSPs) or consultants who support multiple client organizations through the ChromeOS migration process.
This dashboard allows you to:
Manage and monitor multiple customer environments
View readiness insights across each customer domain
Filter and explore device, application, and peripheral compatibility per organization
Accessing the Partner Dashboard
Go to the web dashboard login page
Sign in with your Google account
Upload the customer’s encryption file (after data collection) to view their results securely
Availability Based on Installation Flow
Enterprise Flow: Available to CSPs when GCP Cloud Storage is selected
PowerShell Flow: Available when deployed by a service provider
Which Dashboard Should You Use?
Choose the Pro Dashboard if you are an enterprise IT admin evaluating your own environment
Use the Partner Dashboard if you are a service provider managing readiness across multiple clients
Security and Data Ownership
Regardless of which dashboard you use, data security is a core design principle:
All collected data remains within your organization’s control
Data is encrypted using AES and RSA protocols
Access to readiness insights requires a private key
Local log files are secured via the encryption process
Unauthorized access is prevented only the relevant parties can view the collected data
Conclusion
The ChromeOS Readiness Tool delivers tailored visibility through the Pro and Partner dashboards, helping organizations and service providers alike make informed, confident decisions during migration. By understanding which dashboard fits your role and how to securely access it you can fully leverage the tool’s capabilities and accelerate your ChromeOS transformation.